

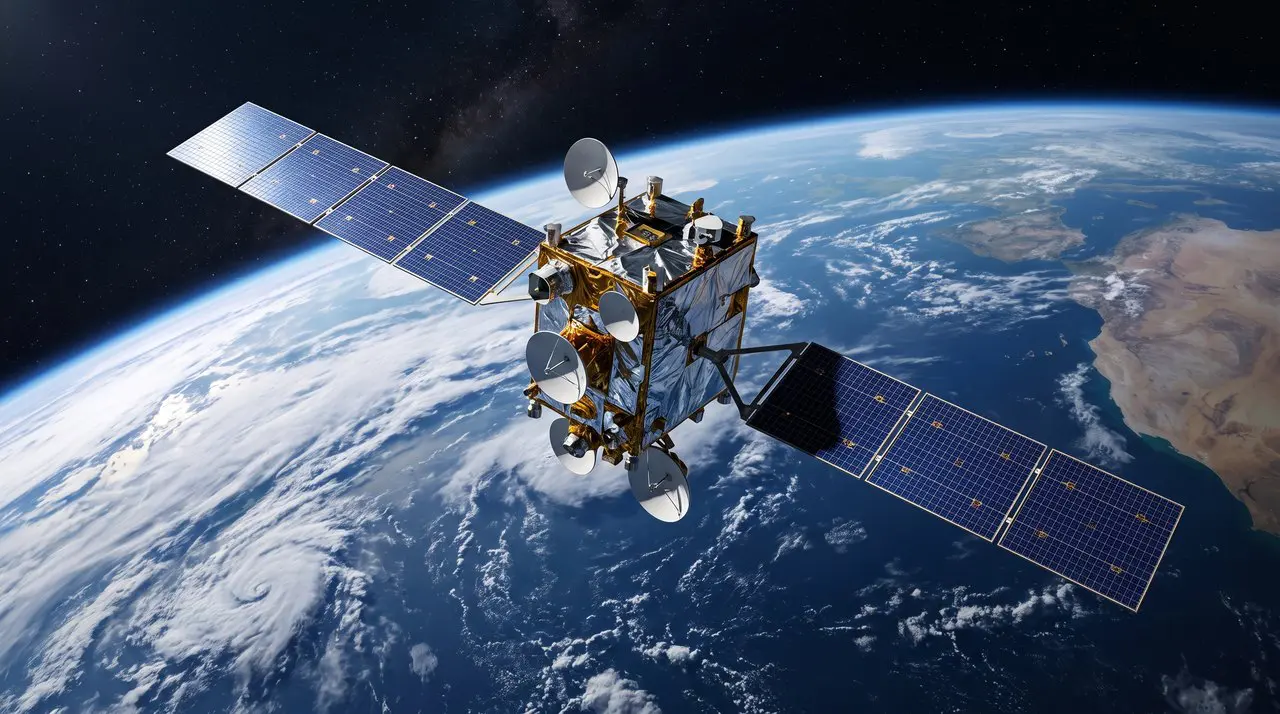
During an 11-day mission in 2000, the Space Shuttle Endeavour orbited Earth 16 times each day, collecting more than a trillion elevation measurements and generating 12.3 terabytes of data. Michigan State University researchers are now applying this information to predict where species will thrive, combining topographical maps with on-the-ground observations. “We have so much satellite-based data now, but ecologists receive very little training on how to work with it,” says postdoctoral associate Kelly Kapsar, highlighting a key barrier to utilizing this resource for biodiversity research.
Satellite Radar Topography Mission Data Reveals Environmental Heterogeneity
The Space Shuttle Endeavour generated 12.3 terabytes of data during its 11-day mapping mission in 2000, representing over a trillion elevation measurements of Earth’s surface and demonstrating the scale of topographical information now accessible to ecologists. This data, initially captured by radar, is now being used to move beyond simple environmental averages and incorporate landscape complexity into biodiversity predictions.
Researchers at Michigan State University are developing metrics to quantify this complexity, acknowledging that organisms experience environments as nuanced mosaics rather than uniform conditions. A single average elevation or rainfall figure obscures critical details influencing species distribution, and the statistical models traditionally used to predict species habitats often rely on single numerical values to characterize environments, a simplification that fails to capture the reality experienced by many animals, according to postdoctoral associate Kelly Kapsar of MSU’s Spatial and Community Ecology, or SpaCE, Lab.
Kapsar explained that animals do not simply take the average of a mountain landscape, but must assess specific features like cliff steepness, terrain roughness, and available cover. To illustrate this point, researchers examined a NEON site in the Sierra Nevada mountains, revealing that an average elevation of 7,050 feet masks significant topographical variation, ranging from 10,000-foot peaks to sheltered valleys.
This focus on environmental heterogeneity extends to climate data as well; while annual precipitation at a NEON site in New Mexico remains consistent around 11 inches, sites in Hawaii experience dramatic year-to-year fluctuations, ranging from 80 to 160 inches.
Co-author Lala Kounta, a climate scientist in the SpaCE Lab, highlighted how these variations create “microclimates, where only certain species can thrive.” The team’s recent work, utilizing the MSU High Performance Computing Center, delivers a set of climate and elevation geodiversity metrics designed to capture this complexity for researchers working at NEON sites across the U.S. These metrics, calculated using an open-source program called GEODIV, assess how “rough” or “smooth” precipitation, temperature, and elevation are across a landscape.
The researchers are not only providing the data but also a guide for others to replicate this analysis globally, bridging the gap between remote sensing capabilities and ecological application. “The idea is to take the satellite’s perspective from way up high in the sky, and NEON’s intensive data collection on the ground—catching bugs, listening for birds, sampling plants—and bring them together to get the best of both worlds,” Kapsar said.
If you think about the world like many animals do, they’re not going to just take the average of a mountain landscape.
Kelly Kapsar, postdoctoral associate in the SpaCE Lab
GEODIV Metrics Capture Landscape Complexity for Biodiversity Prediction
The team’s work, detailed in a recent study, focuses on 47 NEON sites spanning diverse environments from Florida’s Everglades to the Alaskan tundra. They’ve developed an open-source program called GEODIV to calculate these geodiversity metrics, offering a tool for researchers to move beyond simple averages. Kounta said, “They have to contend with things like: How steep is this cliff? Can I climb it? How many ups and downs are there? How bumpy is the terrain?” The temperature and precipitation within an area can vary with the topography and vegetation.
We have so much satellite-based data now, but ecologists receive very little training on how to work with it.
Kelly Kapsar, postdoctoral associate in the SpaCE Lab




See today’s quantum computing news on Quantum Zeitgeist for the latest breakthroughs in qubits, hardware, algorithms, and industry deals.